I heard UMAP is cooler than t-SNE when it comes to visualizing single-cell RNA sequencing (scRNA-seq) data because the local and global distances are meaningful in UMAP, but that was the extent of my knowledge. Then I thought maybe I should learn a little bit more, and so I did. Fortunately enough, there is recorded seminar from SciPy 2018 conference where the author of umap-learn python package, Leland McInnes, talked about the math behind UMAP.
Dimensional reduction
Suppose we have a big dataset, spanning hundreds to thousands of rows (samples) with many columns (features/attributes), visualizing them with 2-dimensional xy chart to see relationship between features is going to be a nightmare. To visualize them, it is often desirable to reduce the dimensions into a handful of meaningful components, such that we could now find latent features in our data.
I have used principal component analysis (PCA) to perform dimensional reduction. I applied PCA to one of my bioinformatic projects, sequence-based mapping (SBM, python module unpublished) to visualize difference in amino acid sequence of viral epitopes. PCA belongs to the matrix factorization class of dimensional reduction, together with algorithms such as latent dirichlet allocation (LDA), linear autoencoder, Word2Vec, etc.
As for PCA, it is great at retaining global structure. It does so by measuring variances, therefore the distance between a point to another point on a principal component is affected or explained by the variances within that principal component. However, PCA might not be able to sufficiently visualize local structure, i.e. it might not be great at grouping things that are similar to one another.
On the other hand, there is a class of algorithms for dimensional reduction called neighbor graphs. This class includes t-SNE and UMAP. It works differently than, say, PCA. t-SNE is great at visualizing local structure, i.e. things that are similar will be grouped together and would appear as a distinct individual cluster, hence it is good at clustering things. However, by being able to sufficiently visualize local structure much more clearly, t-SNE has limitation at preserving the global structure, meaning that inter-cluster distance might not be as meaningful as the intra-cluster distance. In other words, distances between one cluster to another might not be interpretable.
UMAP, although belongs to the same class as t-SNE, has the ability to preserve global structure on top of the local structure. This makes the intra- and inter-cluster distances meaningful. Furthermore, UMAP is faster than t-SNE. In fact, for high-dimensional dataset, t-SNE computation step is often preceded by pre-dimensionality reduction step with PCA.
Charts below shows the differences between PCA, t-SNE, and UMAP with regard to global and local structure.
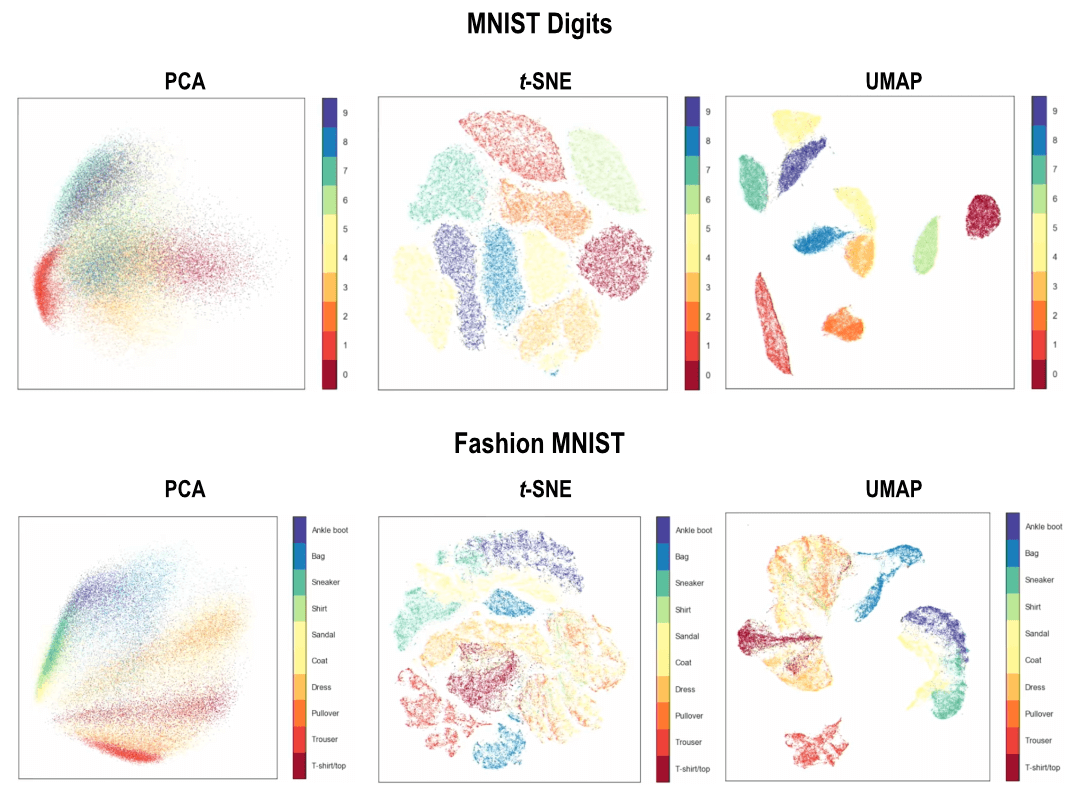
Perhaps it is clearer to compare between t-SNE and UMAP for the fashion MNIST dataset, where you see things we wear on our lower limbs (ankle boot, sandal, and sneaker) are present in the same “constellation” of groups. Meanwhile with t-SNE, you have those strong clustering of each individual distinct type of clothings, but the inter-cluster distances are somewhat arbitrary.
This, in turn, would have an implication when performing scRNA-seq analysis. Here, we expect different cell types to have their own clusters, but at least those derived from myeloid lineage would exist in the same constellation of groups and those derived from lymphoid lineage would exist in another constellation of groups.
Uniform manifold approximation and projection (UMAP)
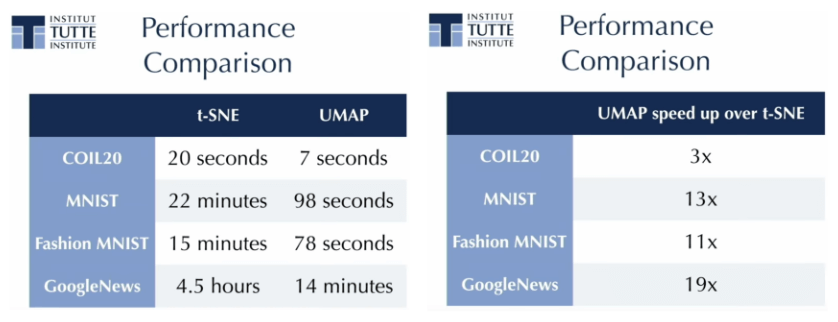
I will not go over the details of UMAP and its implementation here, just a couple of highlights from the talk. First, it is fast. Like, really fast compared to t-SNE.
As a proof-of-concept to visualize how UMAP handles intra- and inter-cluster distances, here is a published study which Leland McInnes is a co-author, argues that “UMAP was able to recapitulate the differentiation stage of T cells within each major cluster, as seen by expression levels of events for the resident-memory markers CD69 and CD103 …”, and further showing that with t-SNE, no apparent structure can be inferred from the visualization (see Figure 1).
Additionally, outputs from UMAP are reproducible than those from t-SNE. This is due to t-SNE’s stochastic behavior, each individual run with t-SNE (assuming not pre-seeded with PCA), would look different from another run. This is generally not the case with PCA. With UMAP, outputs from the same data but from different runs would look relatively similar.