So today I tried making an animated schematic diagram of the Q cycle. The original material from the advanced biochemistry class at the URMC was adapted to make this.
The first step was to sketch the full cycle (cycle #1 and cycle #2) on Inkscape. This was where I spent two-thirds of my time. After sketching the full cycle, then I broke them down into a sequence of (mini) events to be animated.
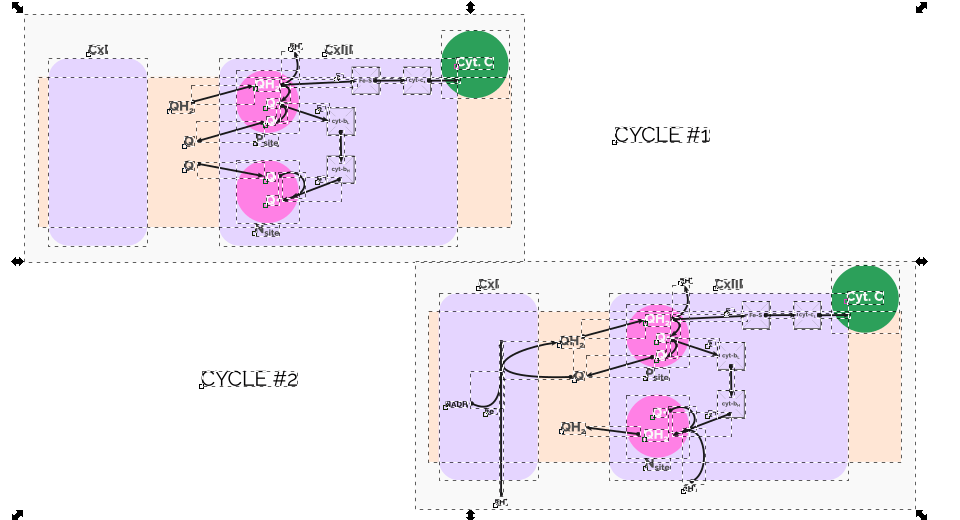 The Q Cycle: object sketches on Inkscape
The next step was to animate the sequences. I exported 8 sequence of events from the Inkscape and then I imported them as layers on Photoshop. By using the Timeline function on the Photoshop CS6, I set the animation to have 2 seconds delay between each layer. Then I exported them (File > Save for Web) with the preset being GIF 128 Dithered.
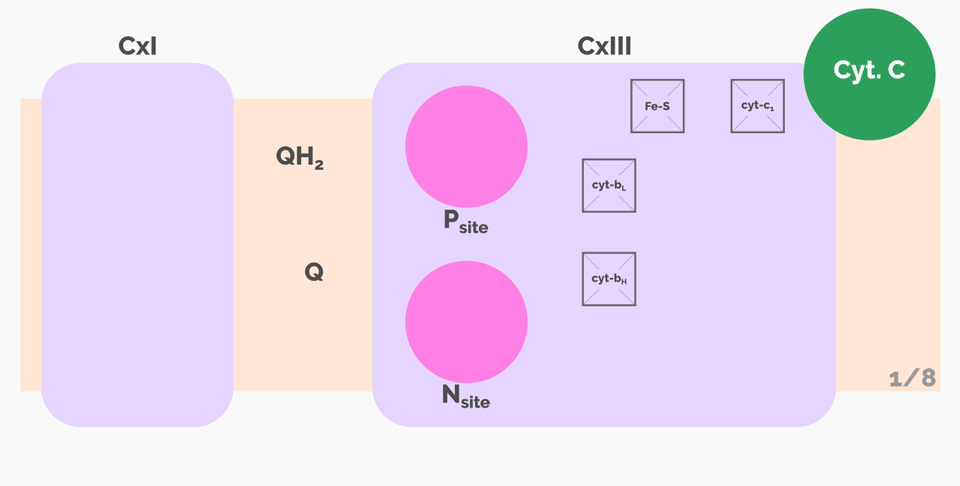 The Q Cycle, animated version. CC-BY 4.0
The final GIF file is about 64 KB in size. Not bad, considering the quality (960px width, 480px height, 72 DPI). The working .PSD file is 1,269 KB while the original .SVG file is 316 KB. If you want to have the original .SVG file, let me know. Soon I will get this on the Wikipedia. Share the knowledge, not fake news!