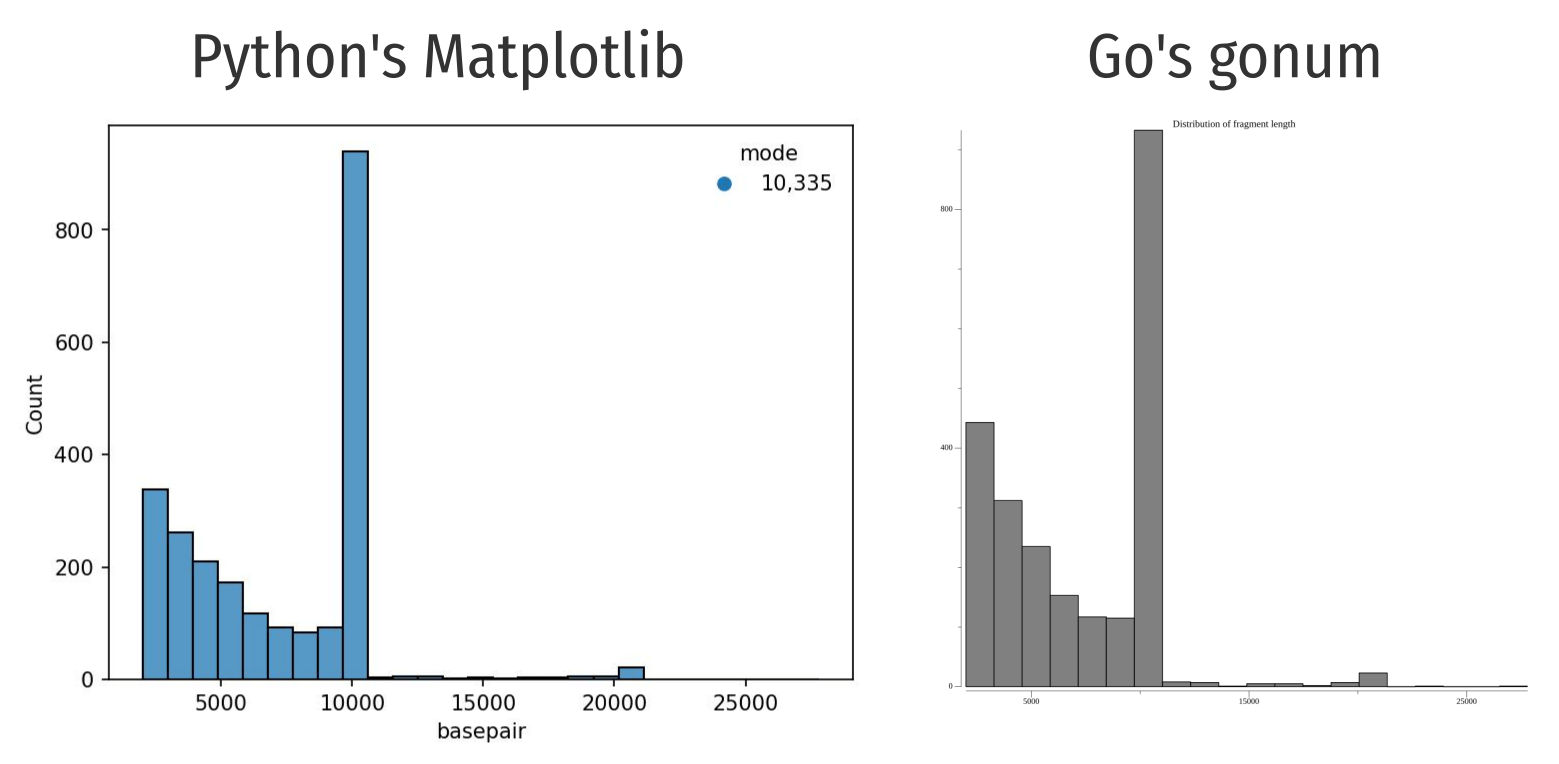
Spoiler alert: the program written in Golang was ~4 times faster than the same program written in Python, but with much less aesthetically pleasing output.
The lab recently started using whole plasmid sequencing (Nanopore) service from Psomagen to inspect plasmids, which we typically do if we receive them from outside sources or if our old stocks are misbehaving. The cost of the service is very affordable, it makes the regular Sanger sequencing a less attractive option when data on the integrity of the whole plasmid is desired.
Psomagen started their Nanopore service recently. At the time of writing, the materials that they provided were only the final consensus sequence and the FASTQ reads (gzipped). Another company that also offers similar service provides more materials, such as annotated plasmid map and distribution of fragment length.
The lab is interested to know the distribution of the fragment length, as it acts as a proxy of the quality of the plasmid stock. Presence of short reads are expected, but we also expect to see a small population of large fragments that can be roughly twice the size of the expected length. These are known as concatemers.
I wrote a python script to generate a histogram, shown below:
import gzip
import matplotlib.pyplot as plt
import seaborn as sns
import argparse
import statistics


def generate_histogram_length(archive: str):
    """
    """
    with gzip.open(archive, "rb") as f:
        lines = f.readlines()
        file_lines_total = len(lines)

        line_skip_for_basecall = 4
        skip_range = range(1, file_lines_total, line_skip_for_basecall)
        skip_range_list = [x for x in skip_range]

        bases_list_length = [len(lines[i].decode().strip()) for i in skip_range_list]
        bases_list_length_1thousand = [x for x in bases_list_length if x >= 2_000]

    mode_count = statistics.mode(bases_list_length_1thousand)

    fig, ax = plt.subplots()
    sns.histplot(bases_list_length_1thousand)
    ax.set_xlabel("basepair")
    ax.plot([], [], linestyle="", marker="o", label=f"{mode_count:,}")
    ax.legend(frameon=False, title="mode")
    fig.savefig("histogram_length.jpg", format="jpg", dpi=150, bbox_inches="tight")


# ------------------------------------------------------------------------------
# Argparse CLI
def cli():
    """
    """
    parser = argparse.ArgumentParser()
    subparsers = parser.add_subparsers(dest="subcommand")

    subparsers_histl = subparsers.add_parser("histl", help="For generating a histogram of read length from a .fastq.gz raw read file")
    subparsers_histl.add_argument("--arc", type=str, required=True, help="Specify a .fastq.gz raw read file")

    args = parser.parse_args()

    if args.subcommand == "histl":
        print("")
        generate_histogram_length(archive=args.arc)
    else:
        parser.print_help()


# ------------------------------------------------------------------------------
# main
if __name__ == "__main__":
    cli()
To use:
python script.py histl --arc "path/to/fastq.gz"
This script comes with some nice features, e.g., plot rendering with Matplotlib and Seaborn, and also a nice CLI user interface with argparse.
The problem is that I need to deploy this script on my colleagues’ computers.
The options were limited: generate compiled binary with pyinstaller or place the script somewhere in the $PATH and satisfy all the dependencies somehow.
And the Python version must also be the right one.
A web application is not ideal since it requires uploading data across the internet (the file can be huge) and somehow the server will need periodic maintenance. The next best option is to turn it into a single binary, which narrowed the options down to two choices: rewrite it in Golang (which I did) or in Rust (which I considered). I chose Golang because I wanted to spend less time writing the code.
package main

import (
	"bufio"
	"compress/gzip"
	"gonum.org/v1/plot"
	"gonum.org/v1/plot/plotter"
	"gonum.org/v1/plot/vg"
	"log"
	"os"
)

func main() {
	fragment_length := FragmentLength(os.Args[1])
	histPlot(fragment_length)
}

func FragmentLength(filename string) plotter.Values {
	file, err := os.Open(filename)
	if err != nil {
		log.Fatal(err)
	}

	gz, err := gzip.NewReader(file)
	if err != nil {
		log.Fatal(err)
	}

	defer file.Close()
	defer gz.Close()

	scanner := bufio.NewScanner(gz)
	line_count := 0
	line_data := []string{}
	var line_length plotter.Values

	for scanner.Scan() {
		// get total line count and prepare data as slice
		// for an easier iteration
		line_count++
		line_data = append(line_data, scanner.Text())
	}

	for i := 1; i < line_count; i += 4 {
		// convert to float64 from int
		// filter anything shorter than 1999 bases
		fragment_length := float64(len(line_data[i]))
		if fragment_length > 1999 {
			line_length = append(line_length, fragment_length)
		}
	}

	return line_length
}

func histPlot(values plotter.Values) {
	p := plot.New()

	p.Title.Text = "Distribution of fragment length"
	hist, err := plotter.NewHist(values, 20)
	if err != nil {
		panic(err)
	}

	p.Add(hist)
	if err := p.Save(10*vg.Inch, 10*vg.Inch, "hist.png"); err != nil {
		panic(err)
	}
}
To compile (targeting Windows and macOS):
GOOS=windows GOARCH=amd64 go build -ldflags "-s -w" -o FragmentDist-win_amd64.exe script.go
GOOS=darwin GOARCH=amd64 go build -ldflags "-s -w" -o FragmentDist-macos_amd64 script.go
To run (assuming the program is in $PATH):
FragmentDist "path/to/fastq.gz"
Having used Matplotlib1 for years, the severe lack of plotting libraries that can generate and then save the plots on disk as PNG/JPG pained me when I was looking for solutions in Golang.
I tried go-echarts/go-echarts but it renders on figures on browser.
Pretty figures though, but shame.
In the end, I settled down with gonum.
But, I would like to point out that the Golang version was written on a Linux system, which then cross-compiled into Windows and macOS binaries, with the final binary size of less than 10 MB.
With pyinstaller (note that cross-compilation is not possible), the binary size was 60 MB.
# golang version
time FragmentDist "example.fastq.gz"
0.28s user 0.02s system 100% cpu 0.306 total

# python version
time python FragmentDist.py histl --arc "example.fastq.gz"
1.21s user 1.15s system 234% cpu 1.004 total
This test run was performed on a Linux machine (Pop!_OS; AMD Ryzen 7 5700X), using a gzipped FASTQ with the size of 20 MB.
The python version was 3.11.4 (compiled through pyenv).
I might revisit this again once I learned how to write programs in Rust :)
Packaging The Python Code
Personally, I like the output from the Python code better.
So I decided to package it, which allows for installation through pip.
Here’s the directory structure:
.
├── pyproject.toml
└── src
   ├── __init__.py
   └── nanohist.py
The original cli() function was rewritten as main(), and nothing else was changed.
The __init__.py is empty.
This is the content for pyproject.toml:
[build-system]
requires = ["setuptools"]
build-backend = "setuptools.build_meta"

[project]
name = "nanohist"
version = "0.0.1"

[project.scripts]
nanohist = "nanohist:main"
While within this package directory, installation was done by issuing pip install . and that’s it.
Of note, if there are several *.fastq.gz files, they can be combined with cat:
cat *.fastq.gz > combined.fastq.gz
And nanohist can be used:
nanohist histl --arc combined.fastq.gz
-
I really don’t understand why some people need to incessantly shit on its API. Sure, it carries some warts from its previous versions, but I do think it is such as powerful plotting library with tons of customization. Its class-based
fig, ax = plt.subplots()interface is so fun to use and to parameterize. I survived my PhD and making beautiful figures at that, thanks to Matplotlib. ↩︎